SpringCloud系列教程 | 第五篇:熔断监控Hystrix Dashboard和Turbine
Springboot: 2.1.6.RELEASE
SpringCloud: Greenwich.SR1
如无特殊说明,本系列教程全采用以上版本
Hystrix-dashboard是一款针对Hystrix进行实时监控的工具,通过Hystrix Dashboard我们可以在直观地看到各Hystrix Command的请求响应时间, 请求成功率等数据。但是只使用Hystrix Dashboard的话, 你只能看到单个应用内的服务信息, 这明显不够。我们需要一个工具能让我们汇总系统内多个服务的数据并显示到Hystrix Dashboard上, 这个工具就是Turbine。
1. Hystrix Dashboard
创建一个新的项目hystrix-dashboard,延用上一篇文章提到的eureka和producer两个项目。
1. hystrix-dashboard pom.xml 依赖包管理
4.0.0 org.springframework.boot spring-boot-starter-parent 2.1.6.RELEASE com.springcloud hystrix-dashboard 0.0.1-SNAPSHOT hystrix-dashboard Demo project for Spring Boot 1.8 Greenwich.SR1 org.springframework.boot spring-boot-starter-actuator org.springframework.boot spring-boot-starter-web org.springframework.cloud spring-cloud-starter-netflix-eureka-client org.springframework.cloud spring-cloud-starter-netflix-hystrix org.springframework.cloud spring-cloud-starter-netflix-hystrix-dashboard org.springframework.cloud spring-cloud-starter-openfeign org.springframework.boot spring-boot-starter-test test org.springframework.cloud spring-cloud-dependencies ${spring-cloud.version} pom import org.springframework.boot spring-boot-maven-plugin
前面介绍过的包我这里不再多说,讲几个前面没有见过的包:
- actuator: 这个包是用来做服务监控的,很多监控相关的功能都会用到这个包,具体的内容我这里先不讲,后面会专门有一篇来讲这个。
- hystrix-dashboard: 这个是今天的主角,hystrix-dashboard帮我们封装好了hystrix的监控面板。
2. 启动类 HystrixDashboardApplication.java
package com.springcloud.hystrixdashboard;import com.netflix.hystrix.contrib.metrics.eventstream.HystrixMetricsStreamServlet;import org.springframework.boot.SpringApplication;import org.springframework.boot.autoconfigure.SpringBootApplication;import org.springframework.boot.web.servlet.ServletRegistrationBean;import org.springframework.cloud.client.circuitbreaker.EnableCircuitBreaker;import org.springframework.cloud.netflix.eureka.EnableEurekaClient;import org.springframework.cloud.netflix.hystrix.dashboard.EnableHystrixDashboard;import org.springframework.cloud.openfeign.EnableFeignClients;import org.springframework.context.annotation.Bean;@SpringBootApplication@EnableEurekaClient@EnableFeignClients@EnableHystrixDashboard@EnableCircuitBreakerpublic class HystrixDashboardApplication { public static void main(String[] args) { SpringApplication.run(HystrixDashboardApplication.class, args); } @Bean public ServletRegistrationBean getServlet(){ HystrixMetricsStreamServlet streamServlet = new HystrixMetricsStreamServlet(); ServletRegistrationBean registrationBean = new ServletRegistrationBean(streamServlet); registrationBean.setLoadOnStartup(1); registrationBean.addUrlMappings("/hystrix.stream"); registrationBean.setName("HystrixMetricsStreamServlet"); return registrationBean; }} 启动类添加启用Hystrix Dashboard和熔断器
注意: 各位看官这里一定要注意,我在这里注册了HystrixMetricsStreamServlet,在springboot1.x版本下,这里是无需注册的,在2.x版本后,这里才需要注册HystrixMetricsStreamServlet,并且显示的给出访问路径。
3. 配置文件
server: port: 8081spring: application: name: spring-cloud-hystrix-dashboardeureka: client: service-url: defaultZone: http://localhost:8761/eureka/feign: hystrix: enabled: true
4. 测试
又到了测试时间,我们先把昨天的eureka和producer CV到今天的工作目录下,顺次启动服务,HystrixDashboard最后启动,启动完成后我们访问:http://localhost:8081/hystrix,将会看到如下界面:
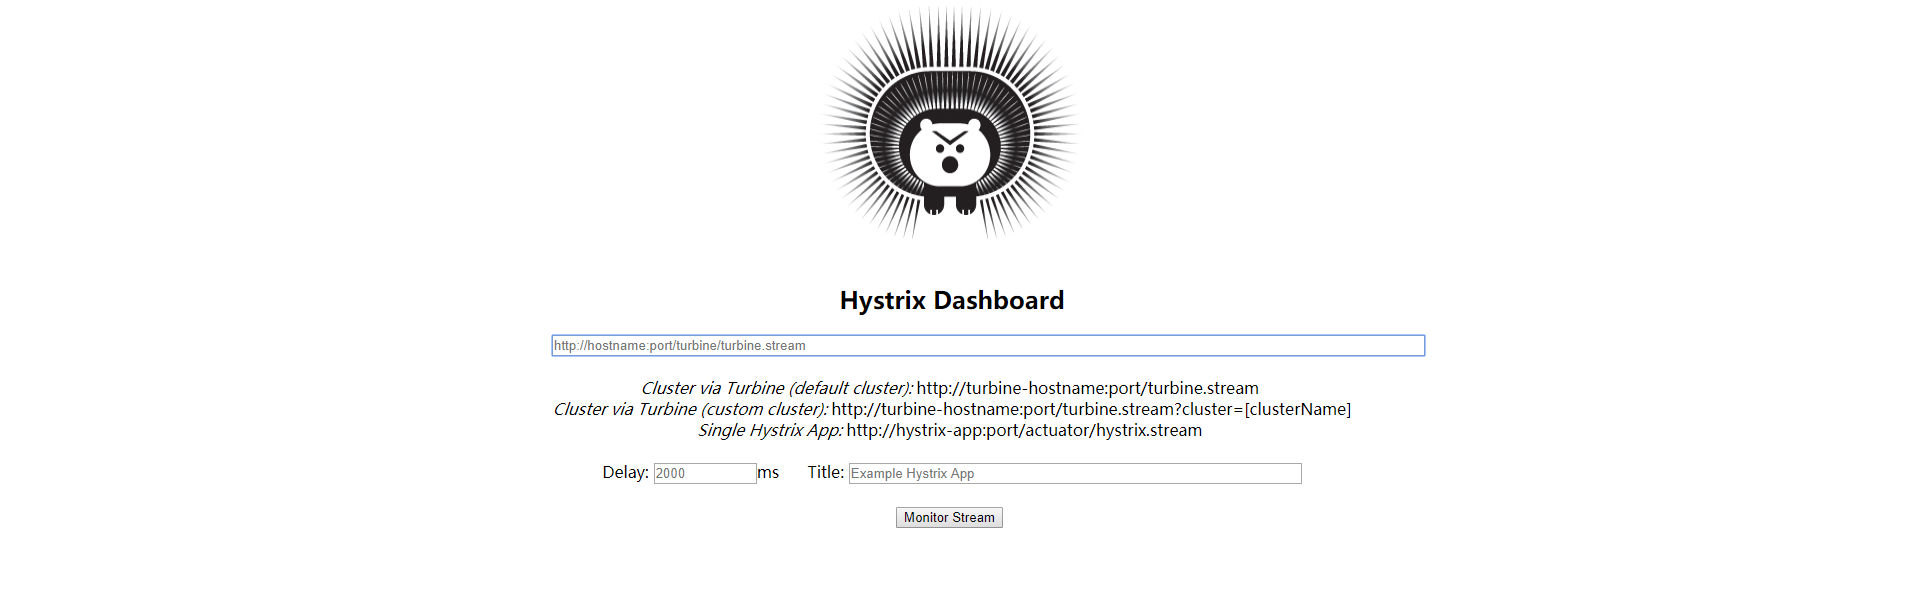
图中会有一些提示:
Cluster via Turbine (default cluster): http://turbine-hostname:port/turbine.stream
Cluster via Turbine (custom cluster): http://turbine-hostname:port/turbine.stream?cluster=[clusterName]
Single Hystrix App: http://hystrix-app:port/hystrix.stream
大致大概意思就是如果查看默认集群使用第一个url,查看指定集群使用第二个url,单个应用的监控使用最后一个,我们暂时只演示单个应用的所以在输入框中输入: http://localhost:8081/hystrix.stream ,输入之后点击 monitor,进入页面。
如果没有请求会先显示Loading ...,访问http://localhost:8081/hystrix.stream 也会不断的显示ping。
我们请求一下昨天用过的链接:http://localhost:8081/hello/spring。
马上就能看到统计信息了。
可以再访问一下http://localhost:8081/hystrix.stream,显示如下:
ping: data: {"type":...}data: {"type":...} 说明已经返回了监控的各项结果.
到了监控页面就会显示如下图所示:
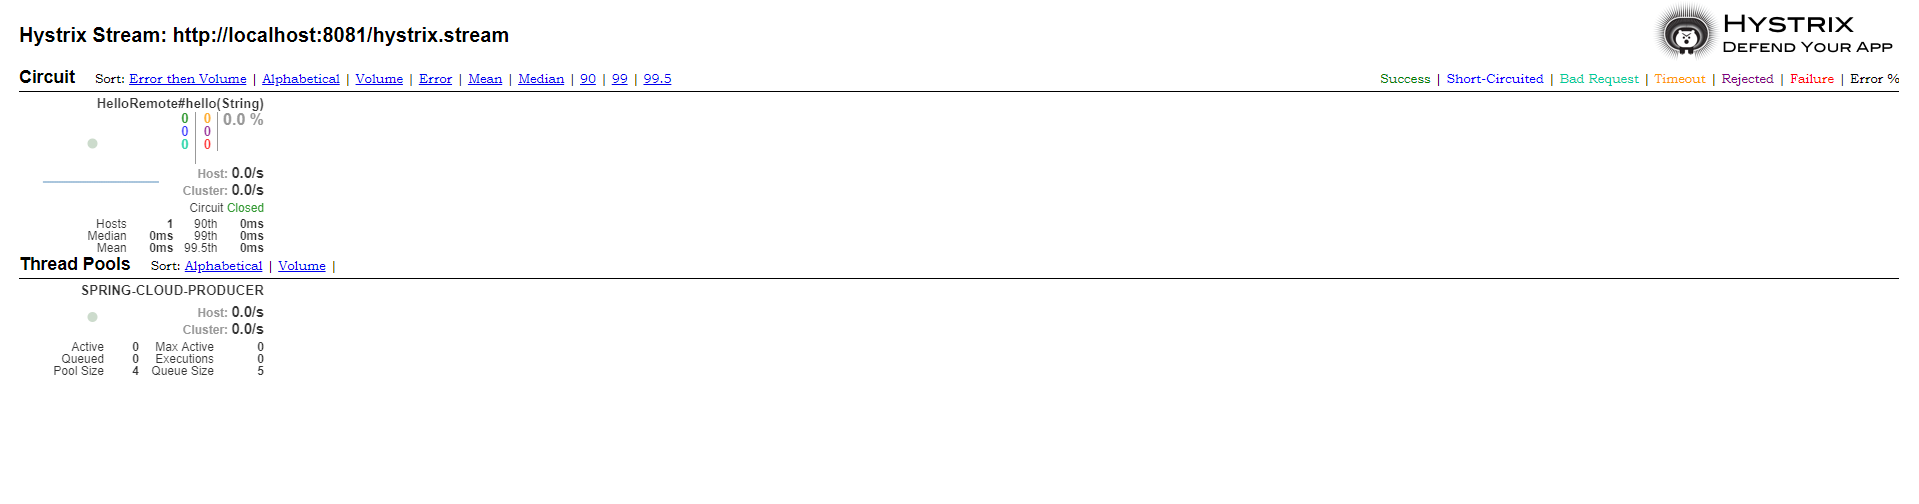
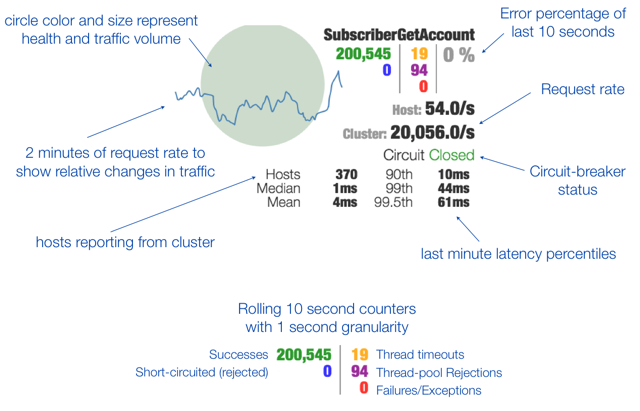
其实就是http://localhost:8081/hystrix.stream返回结果的图形化显示,Hystrix Dashboard Wiki上详细说明了图上每个指标的含义,如下图:
到此单个应用的熔断监控已经完成。
2. Turbine
在复杂的分布式系统中,相同服务的节点经常需要部署上百甚至上千个,很多时候,运维人员希望能够把相同服务的节点状态以一个整体集群的形式展现出来,这样可以更好的把握整个系统的状态。 为此,Netflix提供了一个开源项目(Turbine)来提供把多个hystrix.stream的内容聚合为一个数据源供Dashboard展示。
1. Turbine pom.xml
4.0.0 org.springframework.boot spring-boot-starter-parent 2.1.6.RELEASE com.springcloud turbine 0.0.1-SNAPSHOT turbine Demo project for Spring Boot 1.8 Greenwich.SR1 org.springframework.boot spring-boot-starter-actuator org.springframework.cloud spring-cloud-starter-netflix-hystrix-dashboard org.springframework.cloud spring-cloud-starter-netflix-turbine org.springframework.boot spring-boot-starter-test test org.springframework.cloud spring-cloud-dependencies ${spring-cloud.version} pom import org.springframework.boot spring-boot-maven-plugin
2. 配置文件
server: port: 8888spring: application: name: hystrix-dashboard-turbineturbine: app-config: node01,node02 aggregator: cluster-config: default cluster-name-expression: new String("default") combine-host-port: trueeureka: client: service-url: defaultZone: http://localhost:8761/eureka/ - turbine.appConfig: 配置Eureka中的serviceId列表,表明监控哪些服务
- turbine.aggregator.clusterConfig: 指定聚合哪些集群,多个使用”,”分割,默认为default。可使用http://.../turbine.stream?cluster={clusterConfig之一}访问
- turbine.clusterNameExpression: 1. clusterNameExpression指定集群名称,默认表达式appName;此时:turbine.aggregator.clusterConfig需要配置想要监控的应用名称;2. 当clusterNameExpression: default时,turbine.aggregator.clusterConfig可以不写,因为默认就是default;3. 当clusterNameExpression: metadata[‘cluster’]时,假设想要监控的应用配置了eureka.instance.metadata-map.cluster: ABC,则需要配置,同时turbine.aggregator.clusterConfig: ABC
3. 启动类
启动类添加@EnableTurbine,激活对Turbine的支持
package com.springcloud.turbine;import org.springframework.boot.SpringApplication;import org.springframework.boot.autoconfigure.SpringBootApplication;import org.springframework.cloud.netflix.hystrix.dashboard.EnableHystrixDashboard;import org.springframework.cloud.netflix.turbine.EnableTurbine;@SpringBootApplication@EnableHystrixDashboard@EnableTurbinepublic class TurbineApplication { public static void main(String[] args) { SpringApplication.run(TurbineApplication.class, args); }} 4. 创建消费者集群
将昨天的消费者copy2份到今天的文件路径下,修改名称为consumers-node01,consumers-node02
增加依赖包
org.springframework.cloud spring-cloud-starter-netflix-hystrix-dashboard
启动类增加HystrixMetricsStreamServlet注册
package com.springcloud.consumers;import com.netflix.hystrix.contrib.metrics.eventstream.HystrixMetricsStreamServlet;import org.springframework.boot.SpringApplication;import org.springframework.boot.autoconfigure.SpringBootApplication;import org.springframework.boot.web.servlet.ServletRegistrationBean;import org.springframework.cloud.netflix.eureka.EnableEurekaClient;import org.springframework.cloud.openfeign.EnableFeignClients;import org.springframework.context.annotation.Bean;@SpringBootApplication@EnableEurekaClient@EnableFeignClientspublic class ConsumersApplication { public static void main(String[] args) { SpringApplication.run(ConsumersApplication.class, args); } @Bean public ServletRegistrationBean getServlet(){ HystrixMetricsStreamServlet streamServlet = new HystrixMetricsStreamServlet(); ServletRegistrationBean registrationBean = new ServletRegistrationBean(streamServlet); registrationBean.setLoadOnStartup(1); registrationBean.addUrlMappings("/actuator/hystrix.stream"); registrationBean.setName("HystrixMetricsStreamServlet"); return registrationBean; }} 注意: 这里注册的HystrixMetricsStreamServlet访问路径是"/actuator/hystrix.stream",这是因为Turbine默认访问的是这个路径。
两个配置文件大家自行修改启动端口号,spring.application.name分别修改为node01和node02
5. 测试
现在依次启动注册中心,两个消费者和Turbine,顺次访问两个消费者,并访问 http://localhost:8888/turbine.stream, 会返回和上面一样的一穿ping的信息。
并且会不断刷新以获取实时的监控数据,说明和单个的监控类似,返回监控项目的信息。
进行图形化监控查看,输入:http://localhost:8888/hystrix,返回酷酷的小熊界面,输入: http://localhost:8888/turbine.stream,然后点击 Monitor Stream ,可以看到出现了俩个监控列表(这是理论情况)
注意,这里本地环境无法测试成功,本地环境只能显示一个服务,Turbine日志中会报错
你的主机中的软件中止了一个已建立的连接。
原因目前不明,已经在github上提Issues。